What Drives the Energy Sector
Energy marches to commodity prices more than the economic cycle. A look at how crude, refining margins, and interest rates each pull on the sector.
By Bellwize Staff · October 6, 2026, 10:22 AM ET
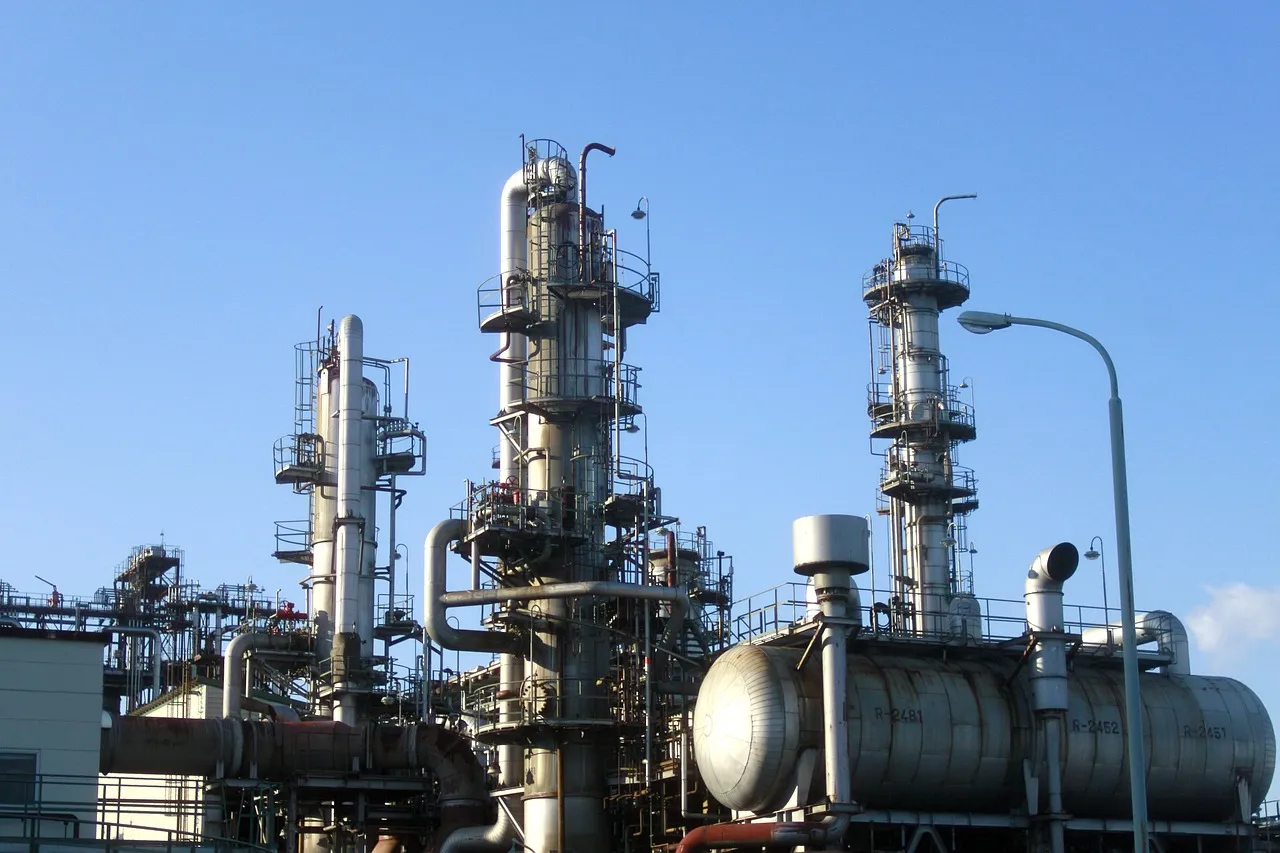
Energy is the one stock-market sector that often ignores what the rest of the market is doing. On a day when technology sells off on rate worries, energy can rally simply because a barrel of oil got more expensive overnight. The reason is simple. The companies in the Energy Select Sector SPDR Fund (XLE) earn their money from commodities whose prices are set in global markets, not from the pace of domestic growth. That makes the sector behave unlike most of the others, and it rewards knowing which levers actually move it.
Crude sets the tempo
Most of the sector’s value sits in companies that pull oil and gas out of the ground, the explorers and producers often called upstream firms. Their revenue tracks the price of a barrel almost directly. When West Texas Intermediate, the U.S. benchmark, or Brent, the international one, climbs from $70 to $85, much of that $15 flows straight to the top line, because the well was already drilled and the cost of lifting the oil barely changed. The leverage runs both ways. A sharp drop in crude can turn a profitable producer into a cash-burning one in a single quarter.
Prices themselves move on supply and demand: production decisions by OPEC and its partners, U.S. shale output, inventory levels, and geopolitical disruptions that threaten supply. Natural gas trades on its own logic, driven heavily by weather and storage. Two commodities, two stories.
Refiners live on the crack spread
Not every energy company wants crude expensive. Refiners buy crude oil and sell gasoline and diesel, and their profit is the gap between the two, a margin the industry calls the crack spread. (The name comes from “cracking” heavy crude into lighter fuels.) A refiner can have a dismal year while oil soars, if pump prices fail to keep pace, and a strong one while oil falls, if those pump prices stay sticky. That is why refining stocks and producer stocks sometimes move in opposite directions on the very same day. The integrated majors that anchor the index do both jobs, pumping oil and refining it, which softens the swings without erasing them.
The rate link runs through the dollar
Energy is not rate-sensitive the way utilities or real estate are, where borrowing costs hit the business model head-on. Its connection to interest rates is mostly indirect, and it travels two routes. The first is the dollar. Oil is priced in dollars worldwide, so when higher U.S. rates lift the currency, a barrel costs more in every other one, which tends to soften global demand and weigh on the price. The second route is the economy itself. Oil demand rises and falls with industrial activity and travel, so anything that slows growth, including the Federal Reserve raising rates to cool it, eventually shows up as thinner consumption. Capital-intensive drilling also gets costlier to finance as rates climb.
None of this is mechanical. That is why energy and interest rates can look disconnected for months and then suddenly matter all at once, often through the currency the Fed’s decisions help set. For more on that machinery, see how the Fed moves markets.
A cyclical sector that pays like a defensive one
Energy sits awkwardly in the usual cyclical-versus-defensive split. Its earnings swing hard. That is textbook cyclical behavior. Yet the big integrated producers have long paid some of the market’s most generous dividends, a trait more associated with steady defensive names. That blend of feast-or-famine profits funding a payout the companies guard closely is much of what makes the sector its own creature.
So when you watch energy, read it in order: the barrel first, the refining margin second, and the broader economy third. On most days the index itself will tell you which one is in charge.
This is a general-market summary for information only — not investment advice, and not a recommendation regarding any security.
Filed under: sectors · energy · explainer